Profit & Loss
Track the financial health of your business with per-trip and aggregate profit & loss reports. Compare expenses against client revenue and monitor your margins across all trips.
Overview
Navigate to Profit & Loss in the sidebar. Eight summary cards sit at the top:
- Total Trips
- Total Revenue
- Total Expenses
- Net Commission — with a sub-line splitting commission in vs. out (disputed receivable commissions are excluded)
- Gross Profit
- Avg Margin
- Profitable — count of trips in the black
- Loss-Making — count of trips in the red
Below the cards, every trip is listed with its revenue, expenses, and profit/loss. A collapsible filter panel lets you set a custom start and end date and filter by trip status (Draft, Sent, Confirmed, Completed, Cancelled). You can sort by date, profit, or margin, and the list is paginated.
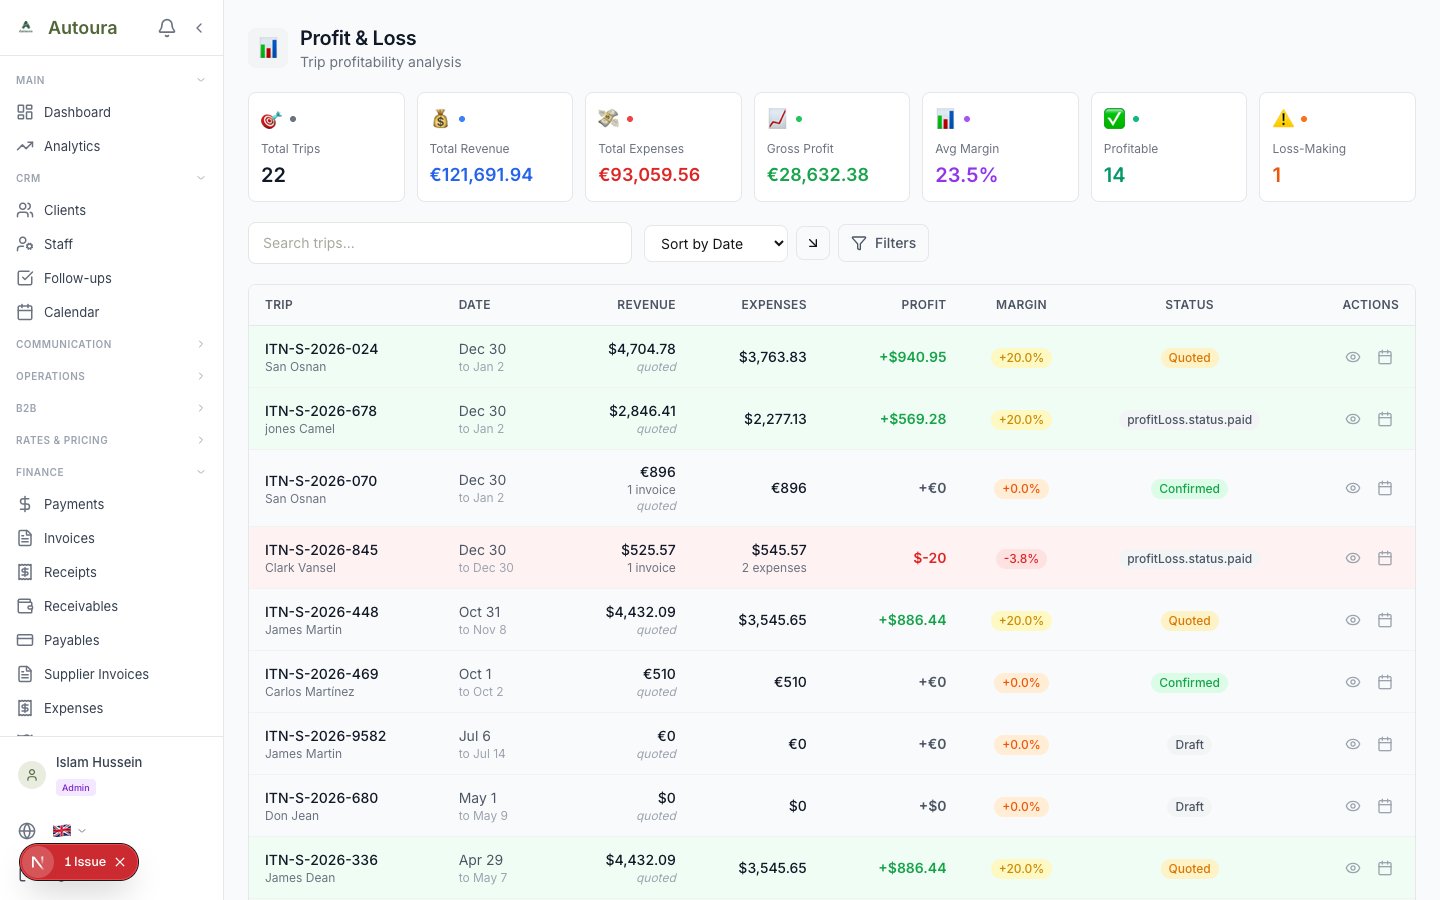
Profit & Loss overview with eight summary cards, filters, and trip list
Per-Trip Breakdown
Click on any trip to see its detailed P&L. The page is built around a single equation — Revenue − Expenses ± Commission = Profit/Loss — with one margin badge for the trip.
- Revenue — What has been invoiced for the trip, with a separate figure for what has actually been paid. If nothing has been invoiced yet, the quoted amount is used instead and flagged with a Quoted amount badge.
- Expenses — Expenses linked to the trip, with a sub-figure for pending (not yet paid) expenses.
- Commission — Net effect of receivable and payable commissions on the trip.
Below the equation, panels show the Expense Breakdown by category, the full Expenses list, the Invoices list, and Trip Details.
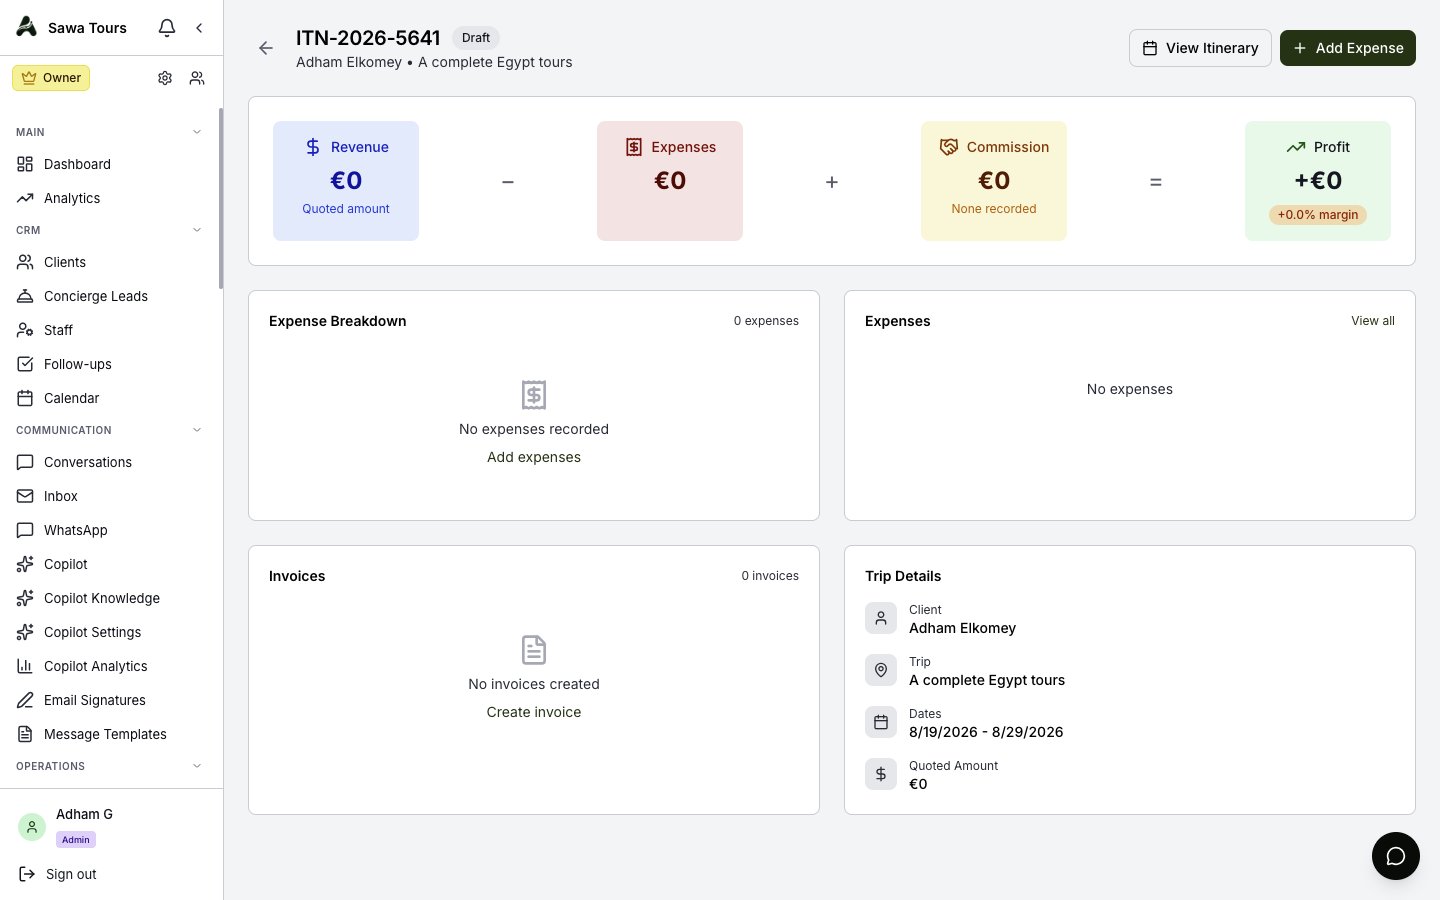
Per-trip P&L page with the Revenue − Expenses ± Commission equation, margin badge, and breakdown panels
Multi-Currency & Data Provenance
All totals are shown in a single reporting currency. When your trips involve multiple currencies, a provenance banner explains exactly how the numbers were produced and warns you about:
- Amounts converted at today's rate — historic transactions converted with the current exchange rate, not the rate on the transaction date
- Amounts excluded entirely — when no exchange rate exists for a currency, those amounts are left out, which means the margin shown is better than reality
- Untranslated trips — trips that could not be brought into the reporting currency
- Unavailable commissions — commissions that could not be included
Where the Numbers Come From
- Revenue — From invoices created for the trip (falling back to the quoted amount when nothing is invoiced)
- Payments Received — From the payments module (actual cash received)
- Expenses — From expenses linked to the itinerary
- Commissions — From the commissions module (receivable and payable)
Reports
In addition to the P&L page, the Reports page (admin/manager only) provides aggregate views across five tabs:
- Overview — including an expense breakdown by category
- Revenue — quarterly and monthly views
- Cash Flow — including receivable and payable figures
- Tax Summary
- Commissions
Every table offers a CSV export.
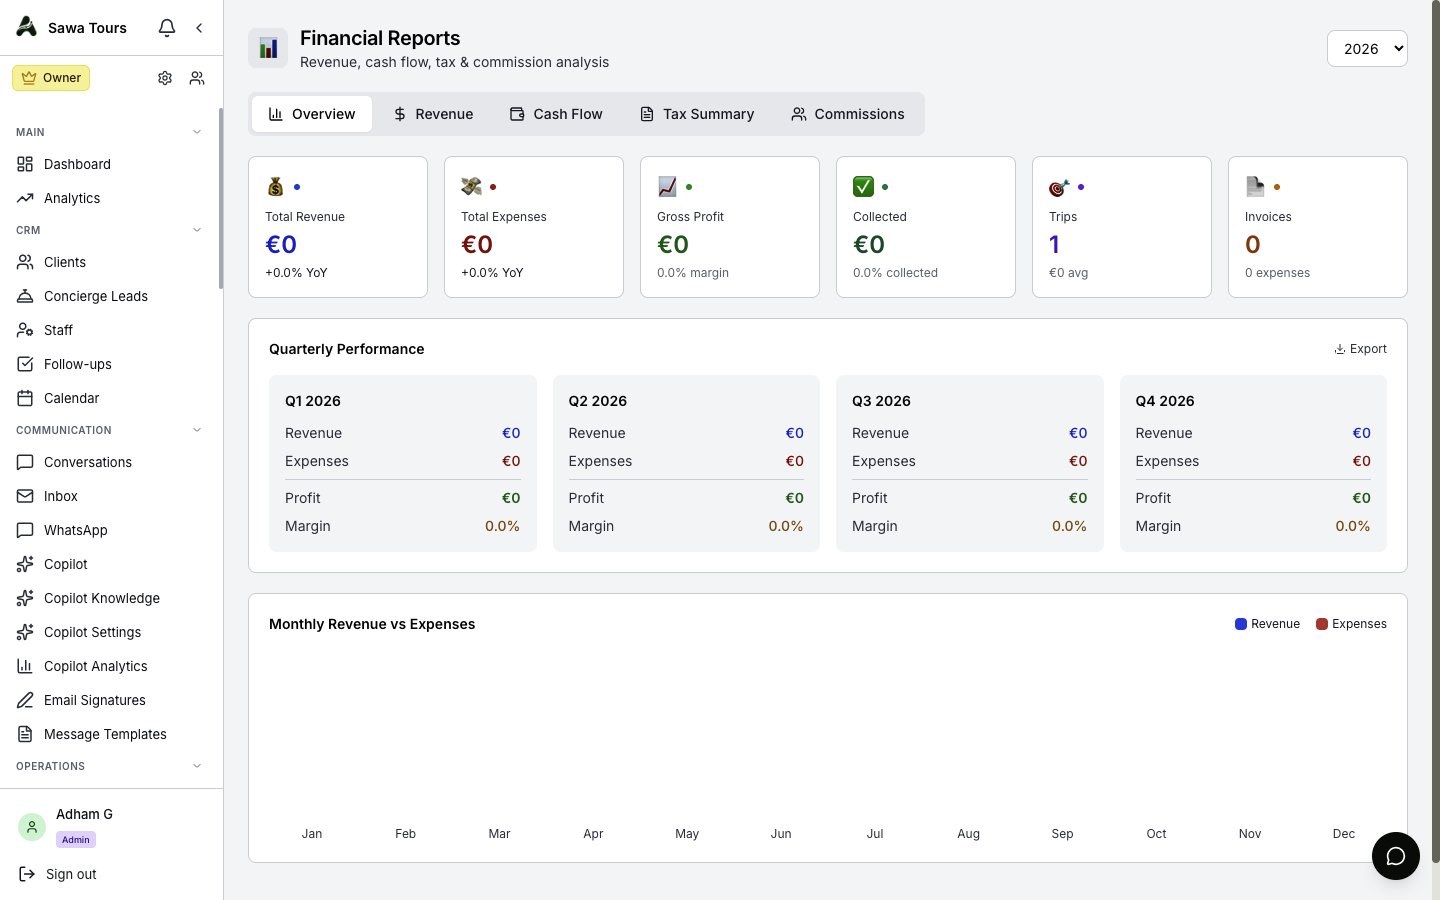
Reports page with Overview, Revenue, Cash Flow, Tax Summary, and Commissions tabs